
The US dollar performance has broken out to its highest level since December 2002, a near 20 year high. This has come as longer-dated US bond yields continue to climb, helping to drive the strong performance of the US dollar. However, with US inflation showing signs of peaking, the reaction on Treasuries and subsequently the US dollar to this week’s US CPI data could be key.
- US real yields soaring into positive territory is helping the US dollar (USD) higher.
- Can this continue if US inflation starts to fall over?
- The major forex levels to watch this week
US real yields drive USD gains
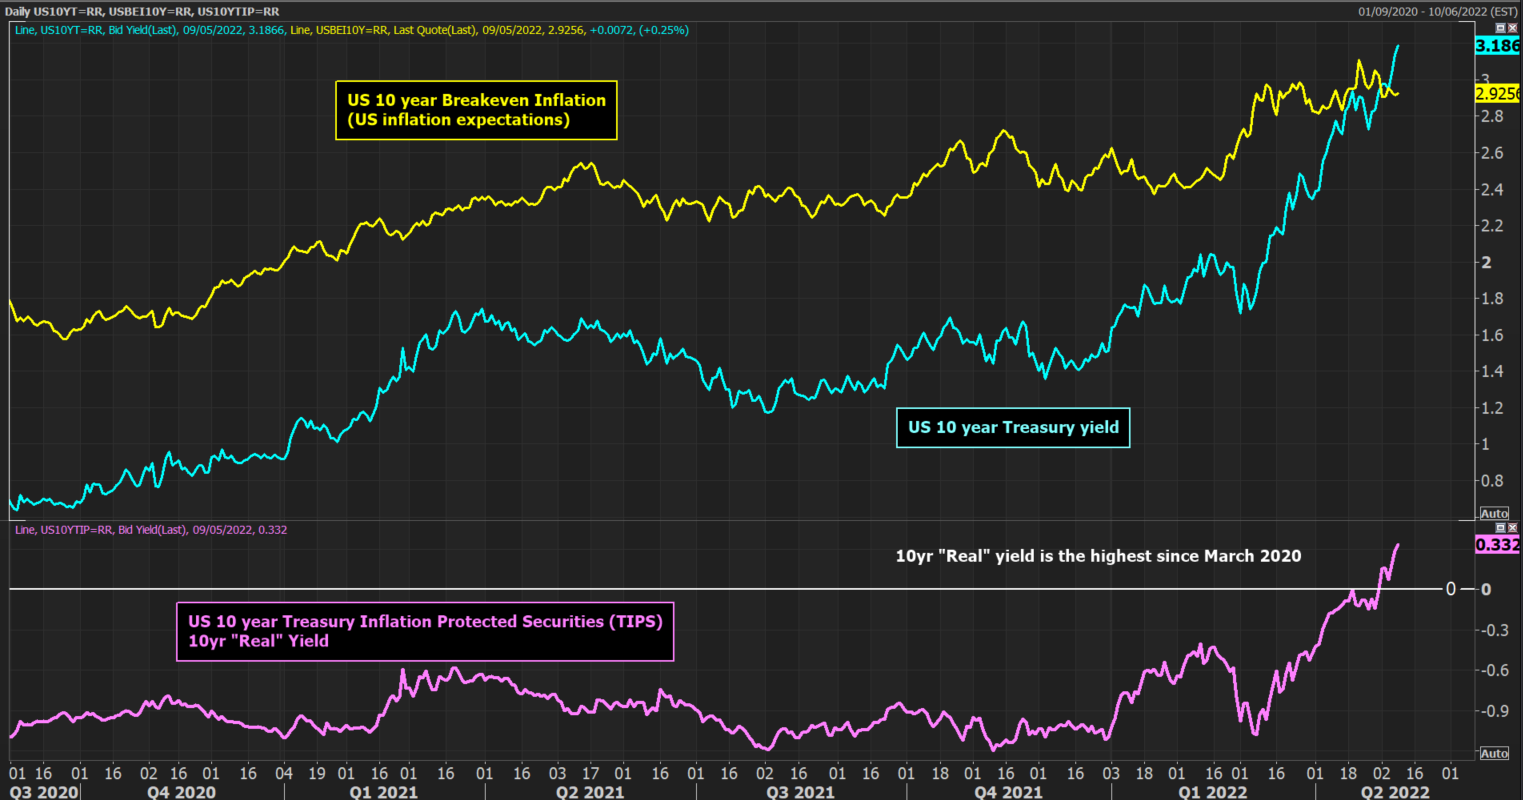
US real bond yields (bond yields accounting for inflation) have soared higher since the beginning of March. This has come as the Treasury yields have accelerated much higher than inflation expectations.
The nominal US 10 year yield has jumped from c. 1.70% to 3.18% in just under 10 weeks. At the same time, inflation expectations (as measured by US 10 year Breakeven Inflation) have risen far less aggressively from around 2.70% to 2.92%. The net effect is that real yields have moved decisively into positive territory for the first time in over 2 years.
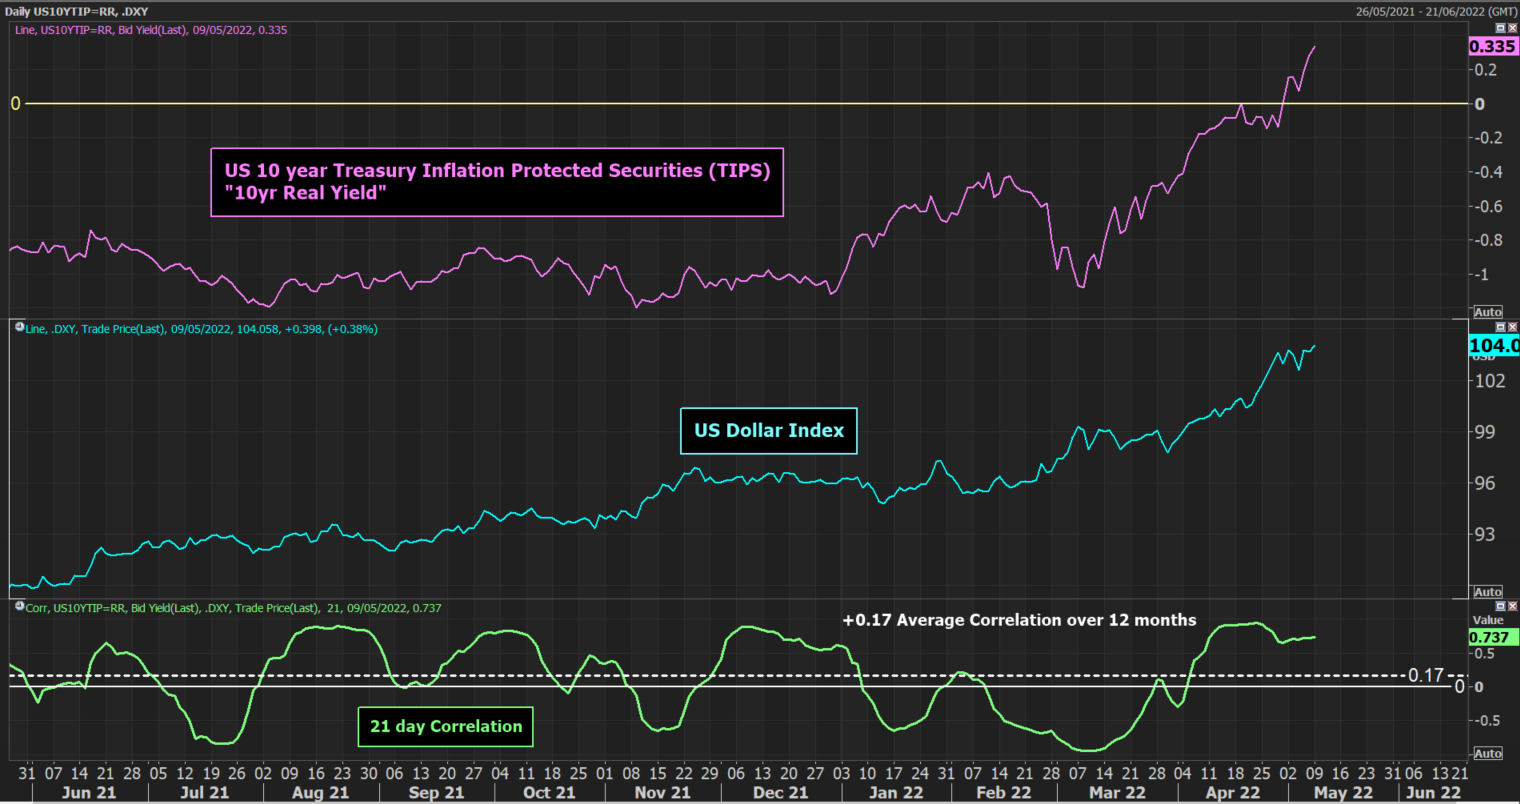
With a positive real yield, this leaves the US dollar as an attractive asset. There is a positive correlation between the USD and real yields. The correlation averages around +0.17 over the last 12 months, but has been a significantly stronger positive correlation in the past month.
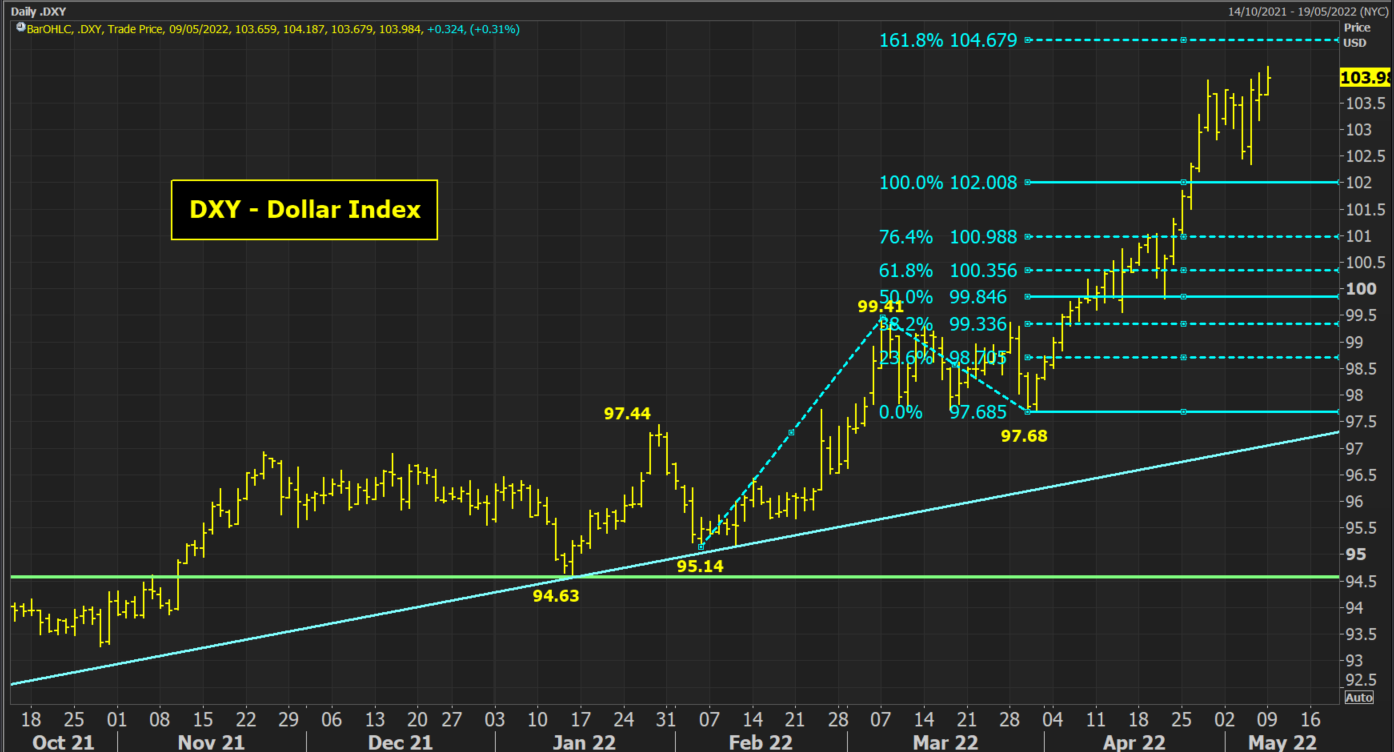
The USD run higher has taken the Dollar Index to 104 today. This is the highest it has been since December 2002, which is a near 20 year high! The market is also looking to break higher today from a recent consolidation. We have previously discussed the Fibonacci projection levels of the latest breakout. The next key projection is the 161.8% Fib target around 104.65.
US inflation appears to be peaking
This Wednesday the US CPI is expected to show a decline in April. This is on both the headline CPI (dropping to 8.2% from 8.5%) and the core CPI (forecast to fall to 6.0% from 6.5%). This comes on favourable base effects as strong April 2021 drops out of the 12-month data set.
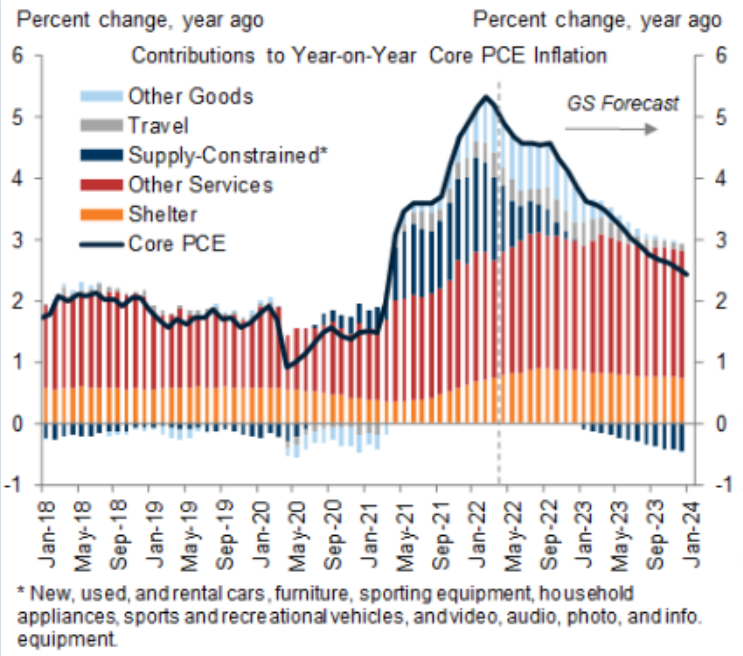
We were interested to see that the US investment bank, Goldman Sachs has started to revise their forecasts for US inflation lower for the first time since early 2021. Looking at core PCE (another way of looking at US inflation, they are anticipating that the peak has been met in US inflation. Here you see their forecasts:
So the key question this week, will be if inflation is rolling over, this may also begin to weigh on inflation expectations. Can US bond yields continue to hold up and will “real” yields continue to rise? If inflation expectations begin to slip more than US Treasury yields, then the “real” yield will continue higher. This would therefore continue to support the USD.
Key levels to watch on major forex in the coming days
Looking at the charts of major forex, there are some big levels to watch.
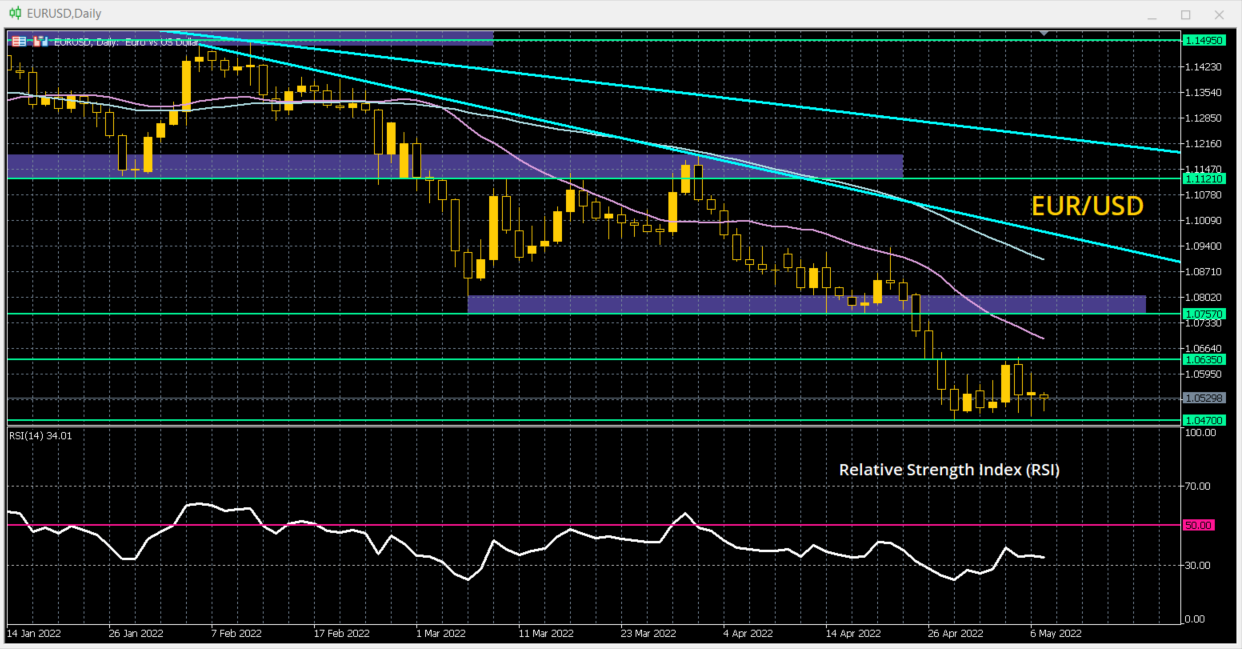
EUR/USD has managed to hold on to the support at 1.0470 over the past 8 sessions. Can this continue after the US CPI data this week? Below 1.0470 opens 1.0325 which is the next key level of support. If US real yields continue higher then this can be expected in the coming days.
However, if US bond yields react negatively to the US CPI data this week, then look towards a test and potential breakout above last week’s high of 1.0640. A downside surprise to the inflation data would drive that move. Above 1.0640 would open 1.0750/1.0800 which is the big overhead supply resistance.
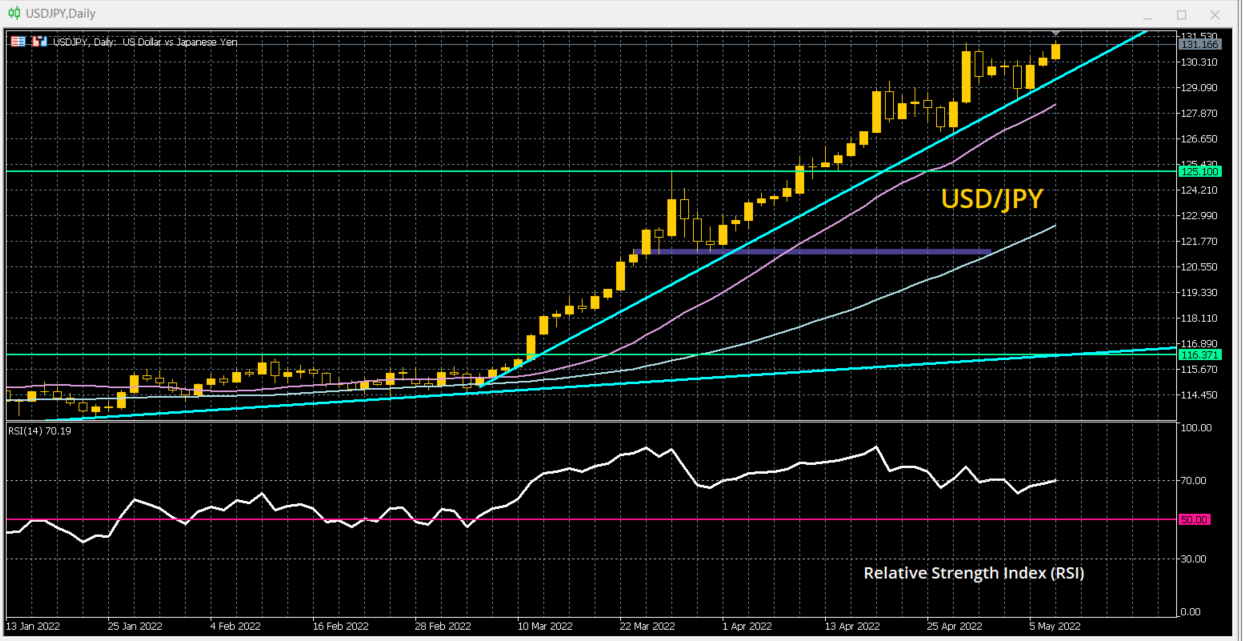
USD/JPY is the market with the closest correlation to US bond yields (especially the US 10 year yield). Higher yields mean USDJPY moving higher. There is a continued uptrend since the beginning of March and the market is looking to break out again today (with yields pushing ever higher). The pair is already trading at 20-year highs (highest since May 2002) and is on course towards the 135.20 high from January 2002. The pair continues to buy into any near term unwinding moves. Subsequently, we will be watching 128.60 (the latest higher low within the uptrend). Any downside inflation surprise could open a test of this support and a downside break opens a deeper correction.
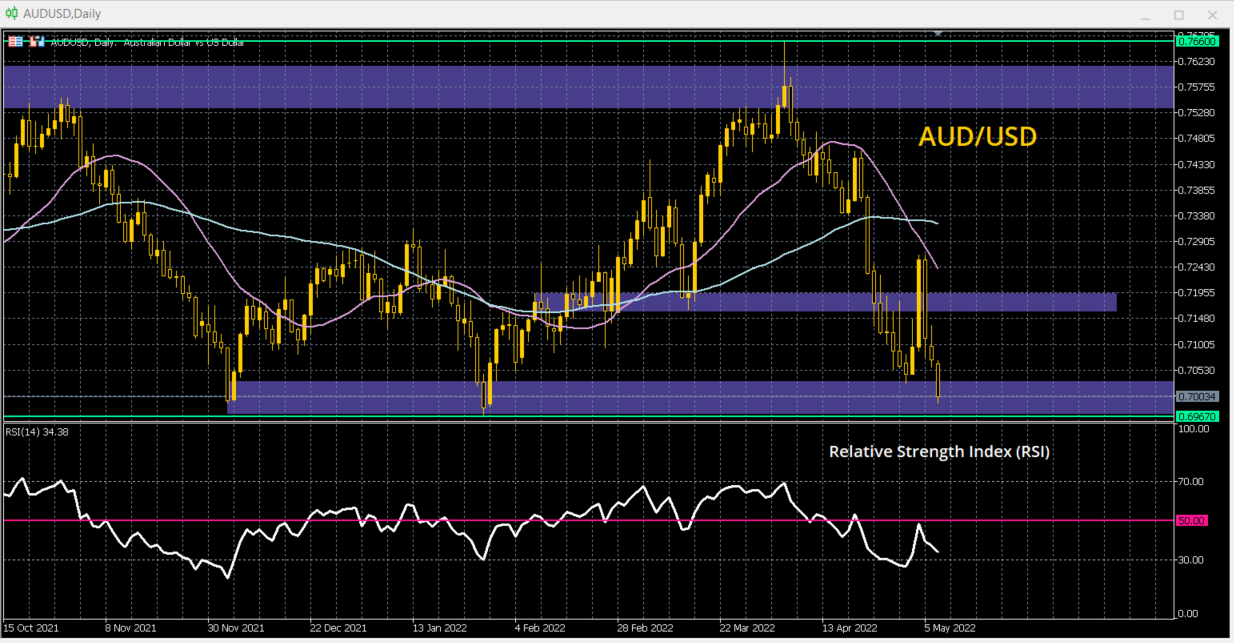
Finally, we see interest in the chart of AUD/USD. A sharp reversal of fortune since the RBA rate hike has put the Aussie on the back foot. So much so, that a test of 0.6965 is coming ahead of the US CPI data. A downside break before the data on Wednesday would not bode well, as it would open levels not seen since July 2020 and constitute a big breach of support. There is a huge amount that now needs to be done to improve the outlook. Trading back above 0.7030/0.7095 would be a start.
This material is for general information purposes only and is not intended as (and should not be considered to be) financial, investment or other advice on which reliance should be placed. INFINOX is not authorised to provide investment advice. No opinion given in the material constitutes a recommendation by INFINOX or the author that any particular investment, security, transaction or investment strategy is suitable for any specific person.


