
Successful trading, regardless of whether it involves forex, stocks, or some other financial markets, is all about analysis. With that being the case, you need a convenient way to access this data. That’s where trading charts become useful.
This article at a glance:
- Trading charts are used by technical analysts to understand price movements over time.
- Understanding these patterns helps analysts make predictions about future price movement.
- The different types of trading charts include line, bar, candlestick, and point and figure charts.
What is a trading chart?
Trading charts show the price movement and trading volume of a financial instrument over time. They indicate the asset’s past and present value, showing patterns of buying and selling activity and telling you how an asset’s value has changed over time.
All this data is essential to technical analysis, where traders analyse price patterns to make trading decisions.
Types of trading charts
The type of trading chart available will often depend on the financial instruments you’re trading. Four of the main types of trading charts you’ll find are:
Line chart
A line chart is the most basic type of trading chart, as it provides a simple overview of price movements over time. It plots individual price movements (mostly each day’s closing price) by dots. These dots connect to form a line.
These charts are an ideal choice for beginner traders because they don't contain too much information. This can also be a disadvantage however, as you won’t have sufficient data for your decision-making.

Bar chart
A bar chart contains more price data than a line chart. Specifically, each bar is represented by a single vertical line that shows highs and lows. The longer the line, the longer the volatility in price movements for a given time frame.
Left and right lines projecting horizontally from this vertical line indicate opening and closing prices respectively. Put together, these charts provide a wider pool of data for technical analysts to use.

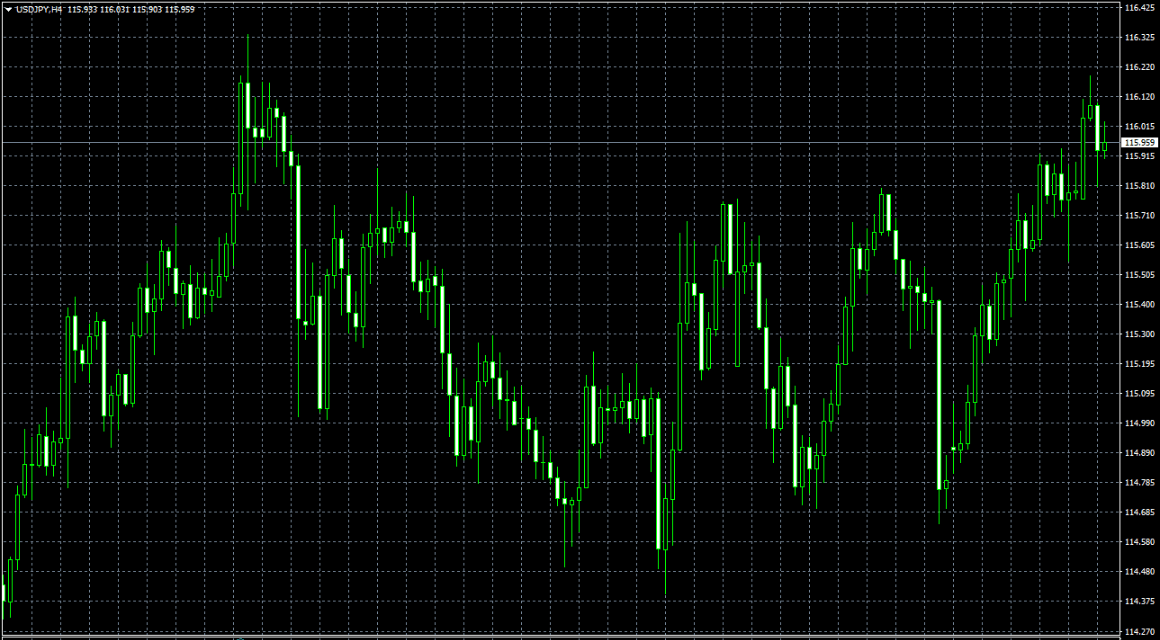
Candlesticks chart
Candlestick charts are the most commonly used charts in the trading world. They present similar information to bar charts, but in a different format. The top and bottom edges of the candlestick show opening and closing prices. Vertical bars extending out of these indicate highs and lows.
Candlestick charts are also colour-coded. Colored, or blocked-out candlesticks indicate higher opening prices. Clear ones, on the other hand, show higher closing prices.
Point and figure chart
To construct a point and figure chart, price increases are marked with an X, and decreases are marked with an O. These charts focus purely on price movements that meet the levels set by the trader, rather than fluctuations over time. For instance, if the box size is set to 2 USD, a point on the chart will only be marked if the price moves by at least that much.
This means you only have a price axis, instead of both price and time axes like in line, bar or candlestick charts.

How to read trading charts
Traders use the price movement data from trading charts to identify price patterns and trends. This information guides them towards either a shift or a continuation of an ongoing price trend.
To understand the data itself, traders use a variety of analytical tools, or indicators. These can be by way of trend lines, support and resistance levels, moving averages, or other technical indicators.
All these tools are available to use through trading platforms such as MetaTrader 4 or 5, which you can access for free through a live or demo account with INFINOX. To learn more about understanding data from trading charts, you can also read our detailed explainer on technical analysis.
This material is for general information purposes only and is not intended as (and should not be considered to be) financial, investment or other advice on which reliance should be placed. INFINOX is not authorised to provide investment advice. No opinion given in the material constitutes a recommendation by INFINOX or the author that any particular investment, security, transaction or investment strategy is suitable for any specific person.


