
When something is trending decisively in one direction, it can seem like a one-way bet. However, monitoring for signs of a reversal is also an important part of risk management in trading. We are seeing precious metals maintaining strong bearish trends in the past couple of months. However, whilst these trends continue to hold, we are starting to see the early signs of what could be the turnaround. These should be noted.
- Real yields are starting to fall back again. Precious metals hold negative correlations with real yields, so if they continue to fall, it should allow metals to build support
- There are also signs of a USD correction threatening. This would also help precious metals find support.
- Technical indicators on gold and silver are starting to look less bearish
Real yields are starting to fall back
Many factors drive metals such as gold. However some of the most significant is the direction of “real” bond yields (bond yields minus inflation expectations) and the US dollar (USD) outlook.
Real yields have been moving sharply higher since early March. This has come as US Treasury yields have shot higher, but inflation expectations have tailed off. Looking at the 10 year “real” yield (as shown in the US 10 year Treasury Inflation Protected Securities), it has moved from c. -1.0% to +0.3%, into positive territory.
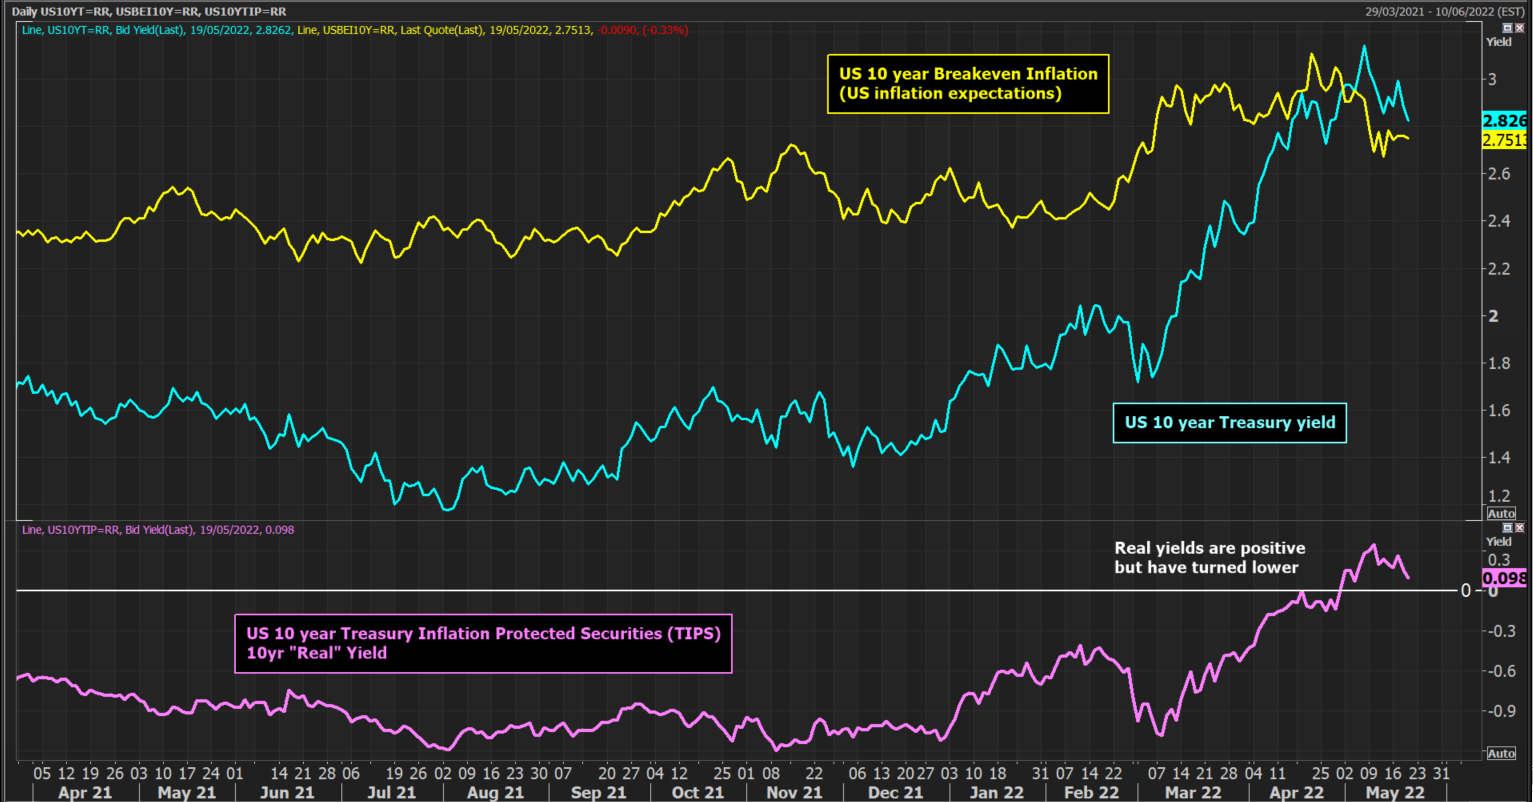
However, we can see that the real yield is starting to drop back in the past couple of weeks. There is a strong negative correlation between gold and real yields. This decline in real yields is starting to impact gold. Lower real yields mean support for gold and likely recovery.

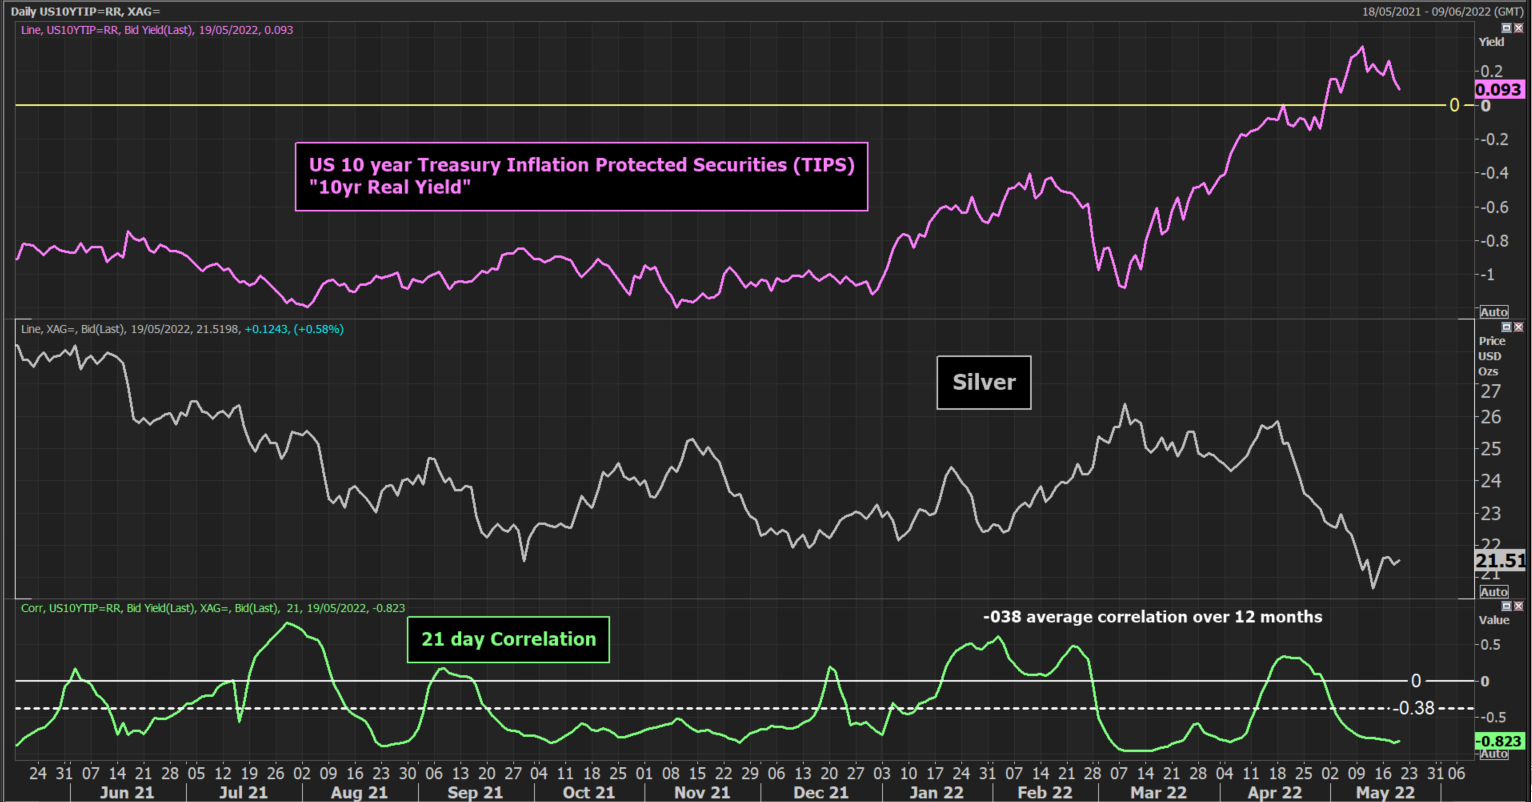
It is not just gold that could be set to benefit from a topping out in real yields. We can also see a similarly strong negative correlation between the real yield and silver.
A USD correlation would also help precious metals
We have also seen that the US dollar is starting to threaten a pullback too (there is a positive correlation between real yields and the USD).
The Dollar Index recent retreated to its 23.6% Fibonacci retracement of the April bull run (c. 103.28). This is an initial consolidation area. The support of yesterday’s low at 103.19 should now be watched. If this is broken on a closing basis, it would suggest momentum to the downside and would open the 38.2% Fib retracement around 102.20.
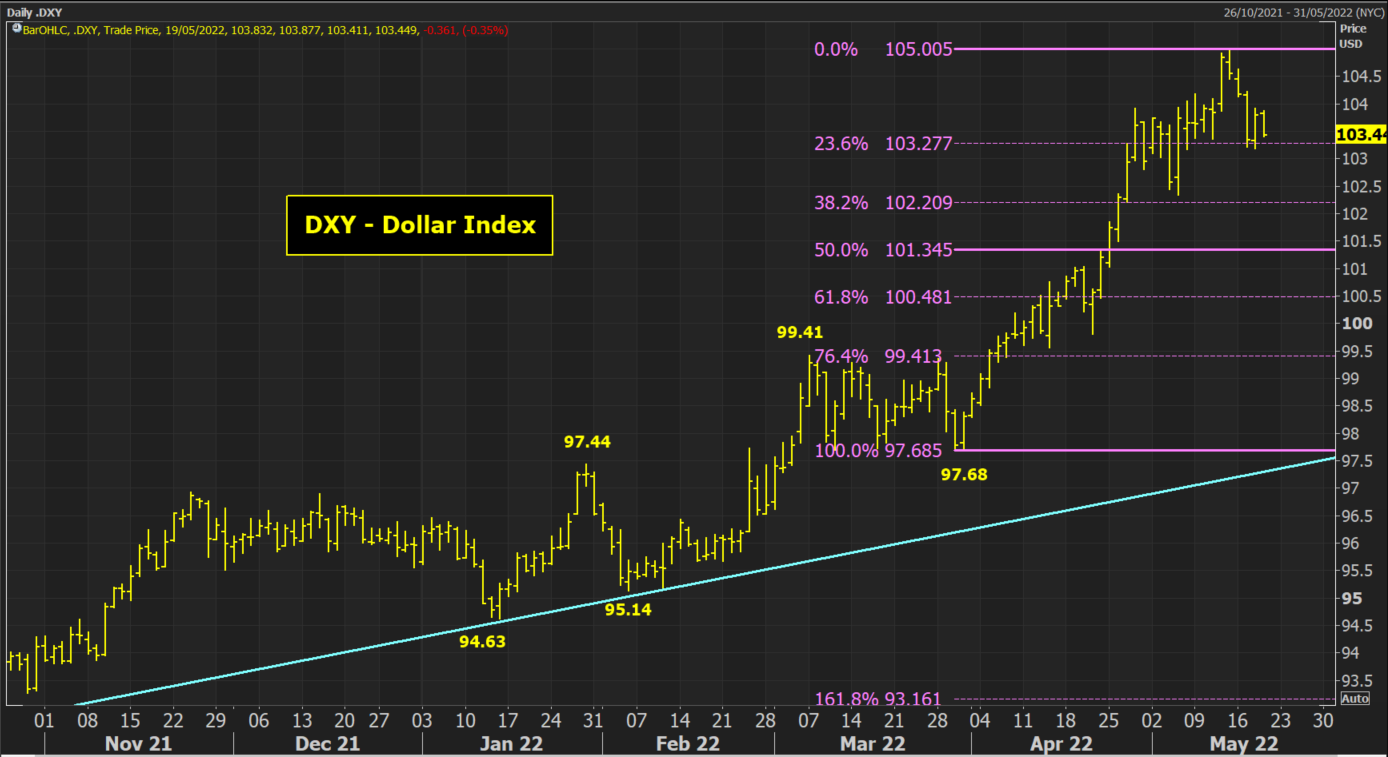
However, we have noted that precious corrective moves on the Dollar Index over the past 8 months have consistently unwound at least to at least the 38.2% Fibonacci retracement. These unwinding moves have been also been as much as a 50% Fibonacci retracement. This would suggest that 102.20 or even towards 101.35 could now be seen in a corrective move.
We note that there is a strong negative 21-day correlation still in place between the USD and Gold. The correlation averages -0.29 over the last 12 months, but is currently around -0.83.
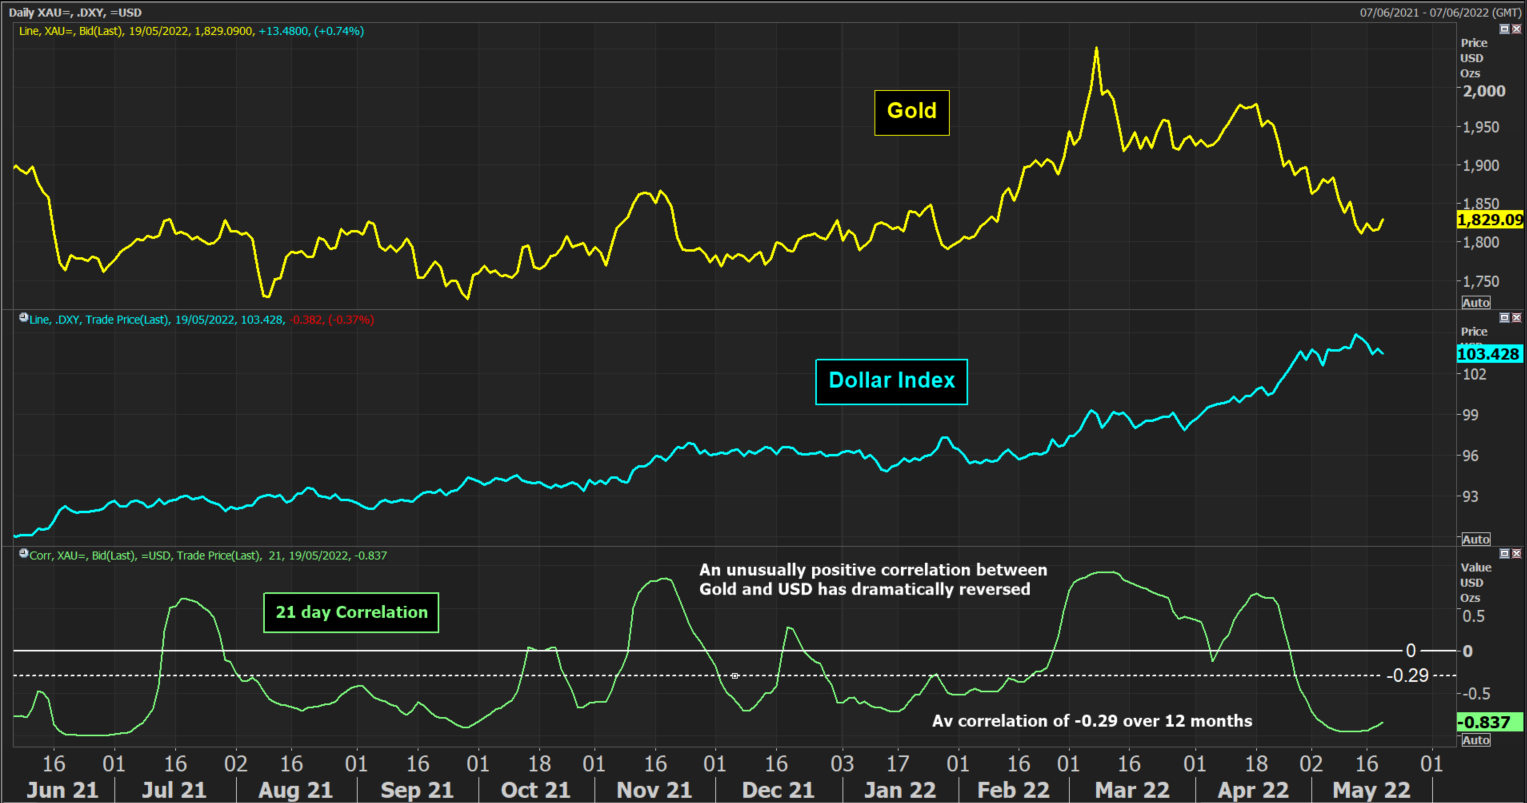
Again this suggests that if the USD does continue to correct, it would be supportive for gold.
Hints of improving technicals
It is interesting to see gold trading higher today. Big selling pressure through equity markets leaves a negative risk bias in markets. However, the dollar is not feeling the benefit of this today. Risk negative sentiment plus a lack of USD strength is adding up to gold pulling higher.
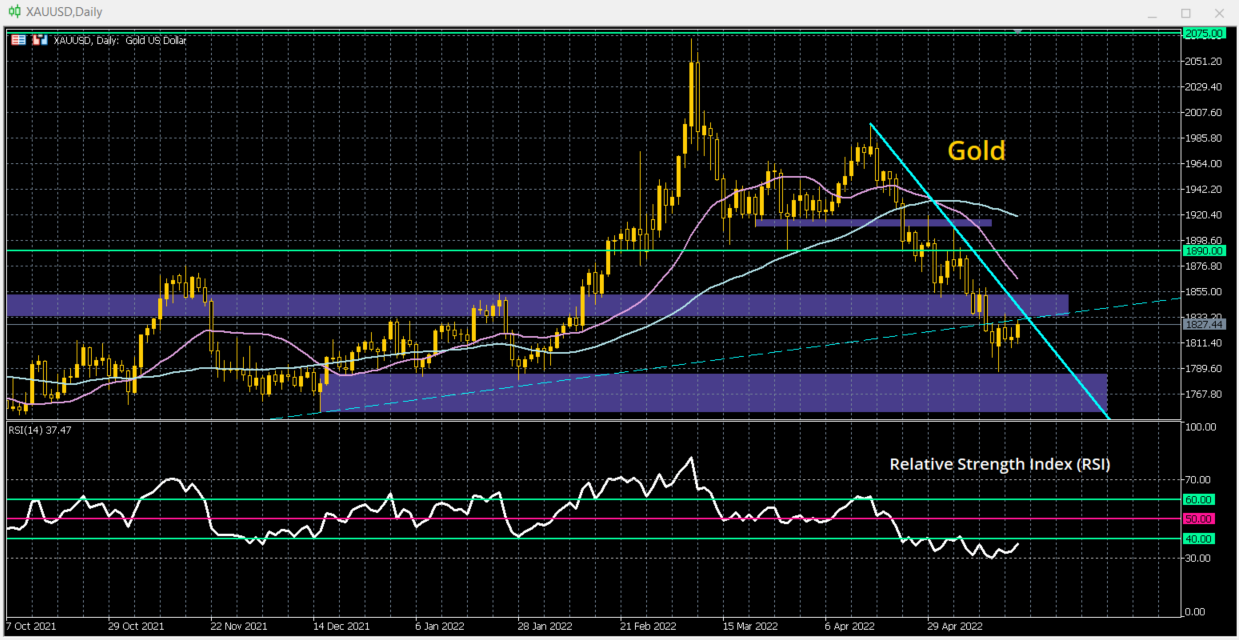
The technicals on Gold (XAUUSD) show a broken 3-year uptrend and a new one-month downtrend. There is resistance at $1830 which is being eyed this morning. For now, there is nothing especially compelling to suggest this is a sustainable recovery (rallies have been consistently sold into since the March high).
However, the price has rebounded from the support area around $1785 just as momentum is picking up (RSI rebounding from oversold at 30). There is near term support forming at $1807 which if resistance at $1836 can be broken would become a higher low whilst also breaking the one-month downtrend.
There is much to be seen if gold can close above $1836, so this is an important phase of trading for gold.
We have also seen Silver (XAGUSD) picking up this week. However, the road to recovery is less clear for silver. Silver tends to be weighed down during times of negative risk sentiment. Technically, there is a massive range of overhead supply that needs to be broken between $21.40/$22.00. This has already resulted in the tailing off of the initial rally this week.
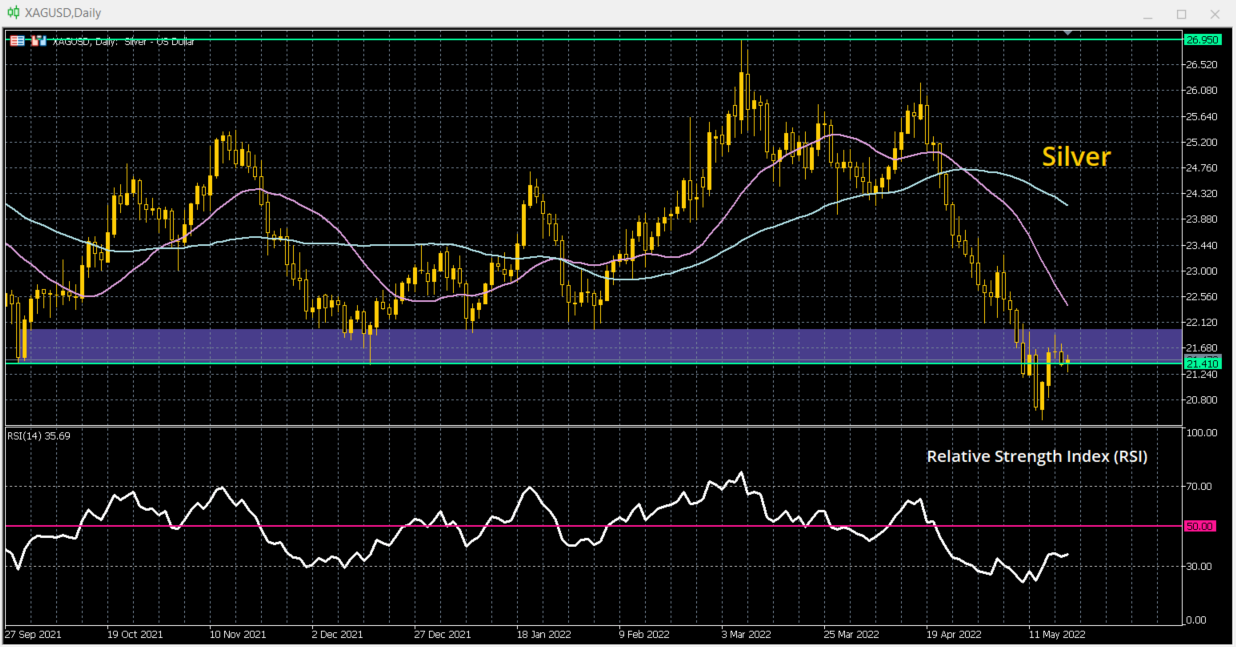
However, resistance at $21.95 is key and if this can be broken then it would complete a small base pattern, something that the RSI is already hinting at. Intraday charts show the need for silver to now form higher low support above $20.45, preferably in a support area between $20.85/$20.20. This would help to improve the prospects of recovery.
This material is for general information purposes only and is not intended as (and should not be considered to be) financial, investment or other advice on which reliance should be placed. INFINOX is not authorised to provide investment advice. No opinion given in the material constitutes a recommendation by INFINOX or the author that any particular investment, security, transaction or investment strategy is suitable for any specific person.


